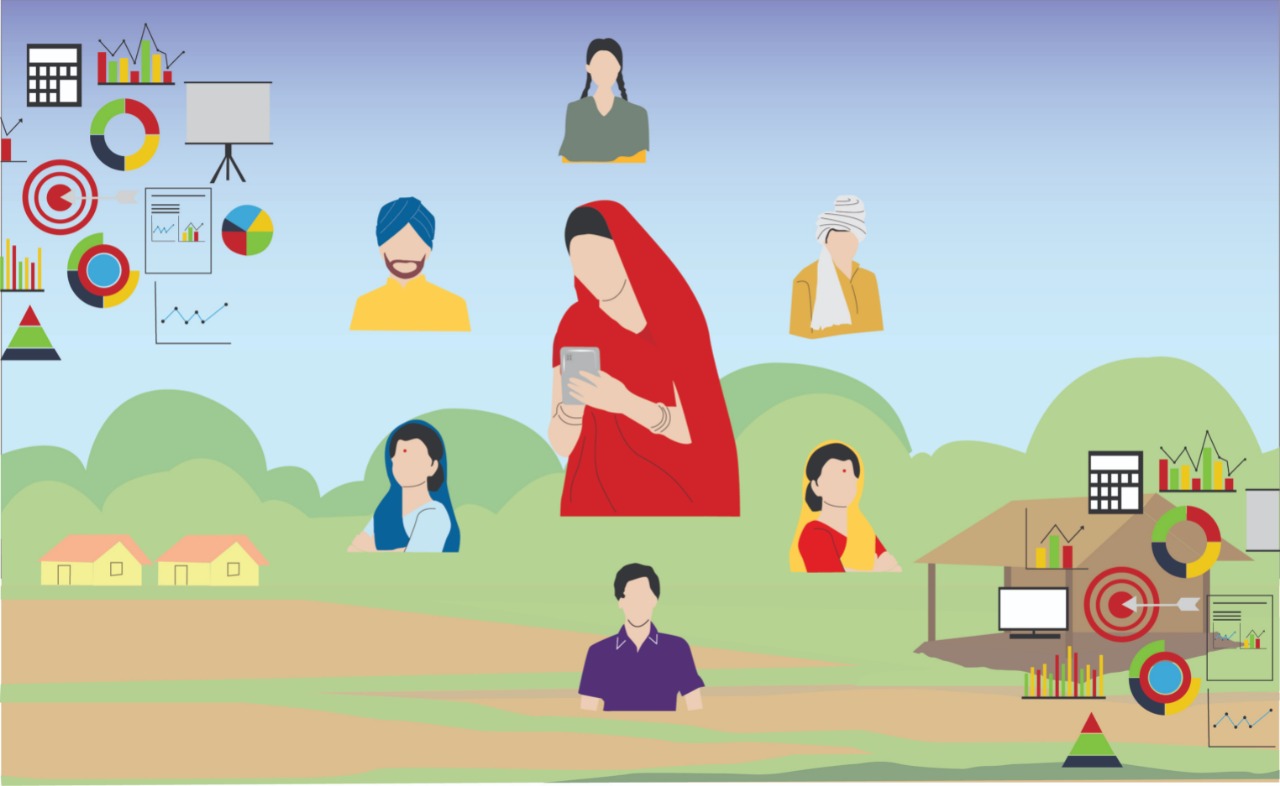
Data of the people, by the people, for the people : Integrating everybody’s perspectives and reaching inclusive solutions
 June 15, 2021

The World Bank Group Flagship Report (2021), “Data for Better Lives” highlights that data can lead towards better social and economic outcomes only if “they are used systematically in ways that create information that generates insights that improve lives”.
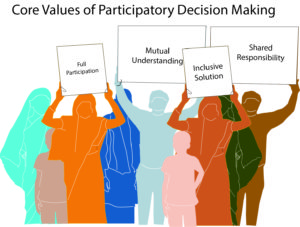
Untapping the enormous potential of group decision making leads to inclusive solutions and shared responsibilities
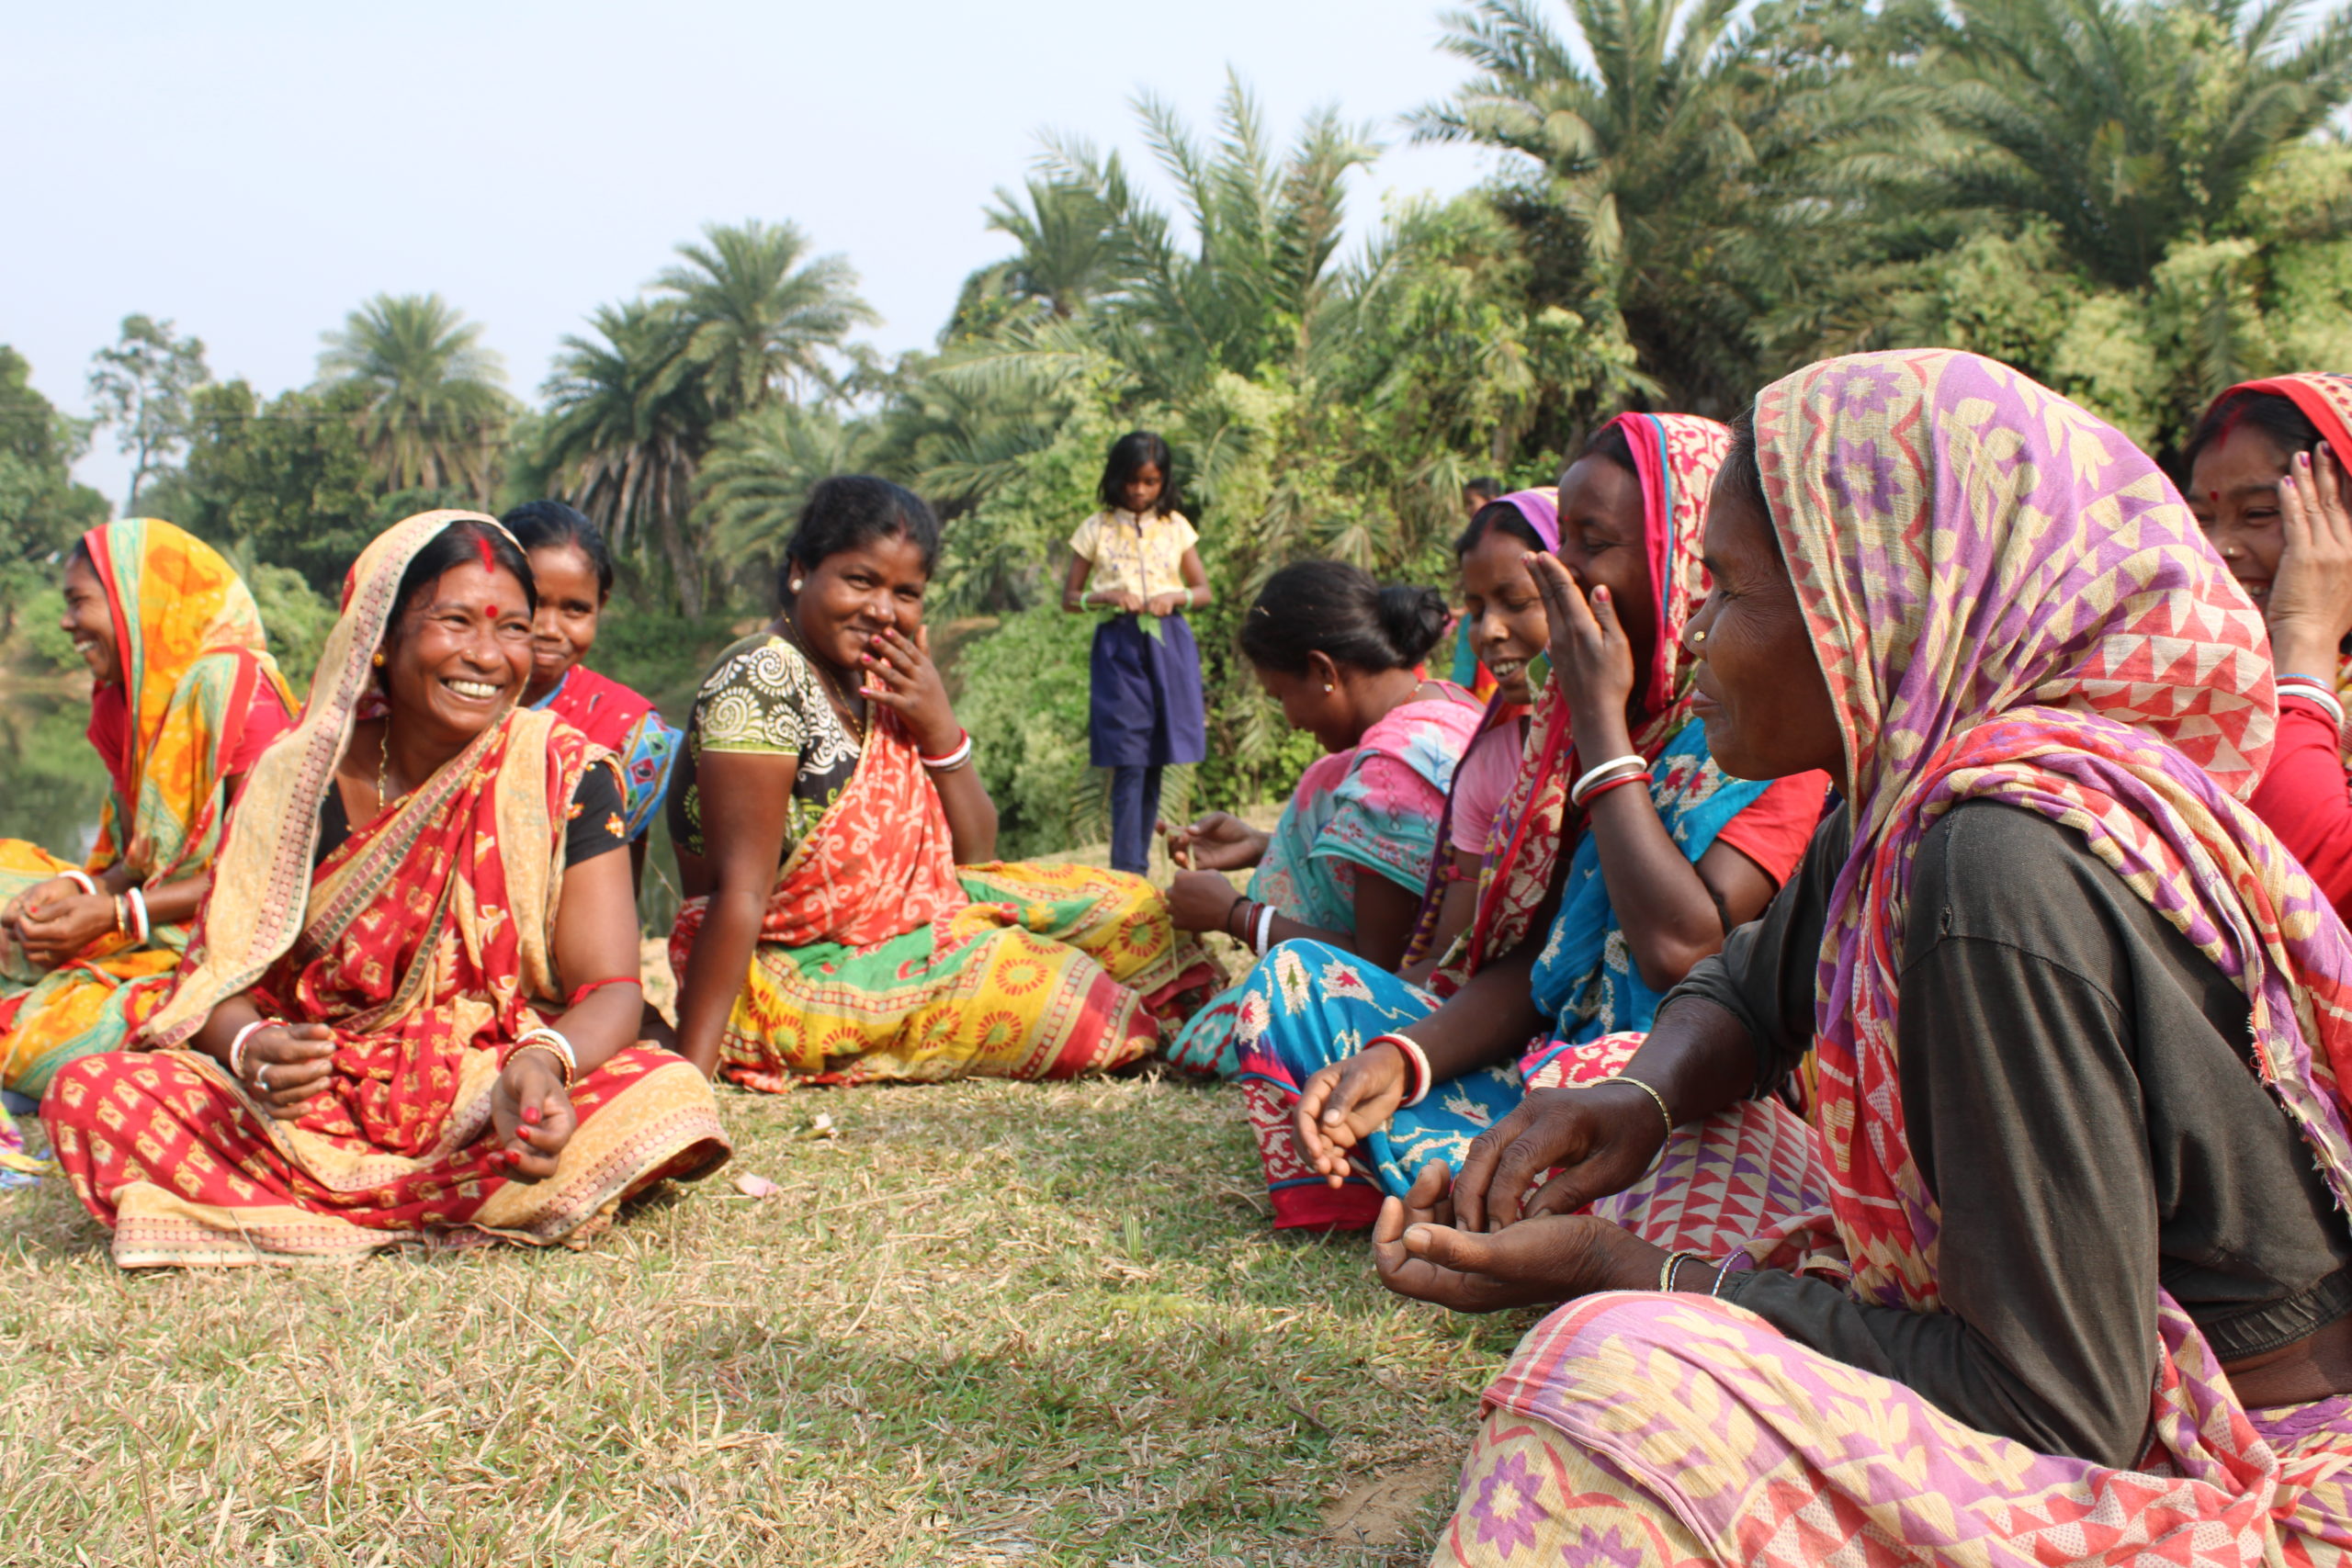
Participatory research is an approach where a researcher involves people or organisations from a community to take part in the research agenda, the research process and to take decisions and act upon their problems. It is based on the principle that local people are creative and are capable of doing their own analysis and planning. Participatory research includes methodologies such as Participatory Rural Appraisal (PRA), Participatory Action Research and Farmer Participatory Research.
Participatory Rural Appraisal is considered to be a popular and effective approach to understand the community or area under study. Under PRA the participants draw maps using local materials to share their knowledge and understanding of their surroundings and households. This enables the researcher to learn about community assets and natural resources. The researcher, based on this understanding may then conduct a research and try to draw insights through an expert’s eye. He or she may then go on to recommend policies to influential authorities and other researchers may use this work as a secondary source.
PRA addresses the importance of including members of a community in understanding the place of study and taking 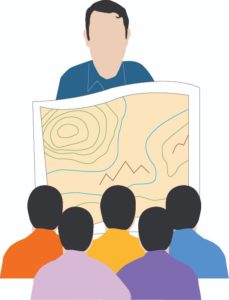 suggestions from a community for policy framing. But PRA does not ensure whether a community will be able to track future changes and take decisions for themselves, with minimal expert intervention. A way ahead in this regard is Participatory Tracking. P-Tracking incorporates almost all the features of PRA but also makes sure that the data flows back to the participants. As the Social Observatory of World Bank states – “Participatory tracking is an annual data collection system that aims to track critical indicators like food security, livelihoods and empowerment. The data collected intends to empower women and construct measures of household well-being that go beyond conventional consumption-based matrices of welfare.” It “enables respondents to choose the data they would like to collect and empowers them to analyze and act on their own data.”
Freedom to design, Right to collect and Independence to analyze their own survey data establishes Data democracy
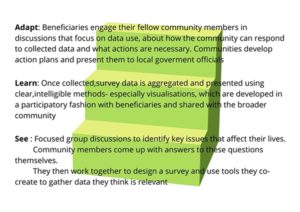
In a P-tracking system the local actors are learning and the external actors facilitate and support local agendas instead of defining those agendas themselves.1 P- tracking has three stages – See, Learn and Adapt
The easy Data Visualization technique undertaken as a part of the Pudhu Vaazhvu project by World Bank is a real life example of proper implementation of P-Tracking system and ensuring efficient outcomes
The P-Tracking system was implemented in the Pudhu Vaazhu Project of Tamil Nadu. A pilot which consisted of three phases 1) Data Collection 2) Data Visualisation and 3) Data feedback, was rolled out in the Theni district. 2
The first phase of data collection included – focus group discussions with Self Help Groups (SHGs) to design the questionnaire, pre-testing with groups of women, developing a tablet-based application to collect data and finally syncing data to a cloud based server every week through a desktop application.
Charts and diagrams have always been the recommended medium to present a data, so that people can quickly interpret. Organisations working towards improving the lives of “Base of the Pyramid” population might face an audience who are illiterate or innumerate and may thus fail to interpret crude statistical diagrams. It is the responsibility of the researcher or organization to simplify the data visuals so that the participants can easily interpret and identify the underperforming indicators. The second phase of data visualization has three clear guiding objectives :
- Revealing visualizations that are multi-dimensional – The goal was to display interesting relationships found in a data. Since there can be many questions in the survey that were related they chose to incorporate related questions into a single visualisation. The below image explains how the level of consumption and cost of food can be displayed in a single image

Source : Social Observatory, World Bank
- Accessible visualizations that are redundant : The goal was to make the visualisation understandable to a diverse audience. For this they used the concept of redundancy used within computer networks, “where the same information is sent multiple times to increase the chances that a message will get through”. Similarly a data can be presented through various channels such as photographs, cartoon images, colors, numerical scales and text when necessary. The below image shows how some social indicators have been displayed through various channels
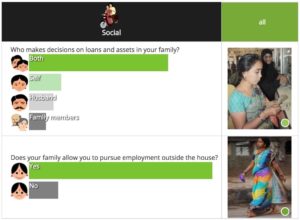
Source : Social Observatory, World Bank
- Actionable visualizations generated using fuzzy indices : Actionable visulaisations should inform definitive steps the community should take to improve situation. For this the women in survey wanted to compare their village to others. The researchers “communicate the score of the index by mapping each score to a color on a spectrum from grey to green”. The below image conveys this concept in a better way
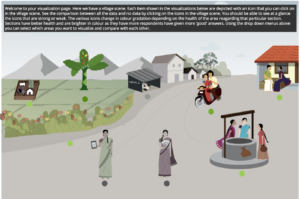
Source : Social Observatory, World Bank
Green represents healthy and grey represents unhealthy or less healthy. “The three women standing around the well represented community participation. The couple riding on the scooter represented social mobility. The couple talking in front of their house represented inter-household decision-making. The toilet represented health and sanitation. The banana tree represented nutrition. The woman holding the tablet represented technology utilization. The woman holding the money represented economic spending. Two icons, the asset box and flowers referenced the visualizations directly, rather than the concepts they described.”
In the third phase the experts received feedback on the data visuals they prepared. The experts represented the data with images that they thought best described an indicator. The experts did not explain what they tried to replicate through an image but wanted to know from the participants as to what they derive by seeing such an image. Corrections were made and new suggestions from the participants were incorporated before the final posters were put out.
The surveyed villages in Theni were divided into treatment groups and a control groups – the treatment groups received their visualized data and control groups did not. The motive was to understand “whether access to data led to improved outcomes and empowerment”
The outcome of the pilot survey indicated that simple data visualisation techniques can empower a community and help them take decisions
- Gram Sabhas where visualisations were tested had better participation and higher attendance than those that did not
- Women participation was also greater in treatment VPs throughout the Gram Sabha. Women who participated felt that the flex-based visualisation enabled them to understand and participate more effectively in the Gram Sabha
- Issues raised in control VPs were based on people’s opinions and not facts or data
The collaboration between the experts in data analysis and the innumerate population can lead to the dissemination of data and ensure better policy making
Participatory techniques aim to break the silence of the poor and disadvantaged sections, recognize the value of popular collective knowledge and wisdom and legitimize the production of knowledge by the people themselves.3
In eastern Uganda “participatory monitoring and evaluation (M&E) approaches were useful for identifying key local problems and feasible local solutions and informing the activities that were subsequently implemented. During the implementation phase, the M&E approaches provided evidence that informed decision-making and helped identify emerging issues, such as weak implementation by some village health teams, health facility constraints such as poor use of standard guidelines, lack of placenta disposal pits, inadequate fuel for the ambulance at some facilities, and poor care for low birth weight infants. Sharing this information with key stakeholders prompted them to take appropriate actions. For example, the sub-county leadership constructed placenta disposal pits, the district health officer provided fuel for ambulances, and health workers received refresher training and mentorship on how to care for newborns.”
Participatory Tracking can make data easily accessible to the rural community so that they can continuously assess their progress and take decisions for themselves. Though there are certain pre-requisites to a successful P-Tracking project, the most important being good network connectivity and access to a digital mobile device, the proper utilization of P-Tracking will help both the elite and the poor reap the fruits of “data”.
Endnotes:
1 Michael Moses, “Power to the People – Participatory Tracking, and Learning to Navigate Complexity,” Global Integrity, March 10, 2017, https://www.globalintegrity.org/2017/03/10/power-people-participatory-tracking-learning-navigate-complexity/
2 Smriti Sakhamuri, “Participatory Tracking : Data collection,” The Social Observatory, April, 2017, https://socialobservatory.worldbank.org/articles/participatory-tracking-data-collection
3 “Training module on PRA tools,” FAO, accessed June 6, 2021, http://www.fao.org/3/ad346e/ad346e0f.htm
References :
Campilan,Dindo. “Participatory evaluation of participatory research”, https://www.betterevaluation.org/sites/default/files/39-56_0.pdf
Kananura, M.R., Elizabeth Ekirapa-Kiracho , Ligia Paina , Ahmed Bumba, Godfrey Mulekwa, Dinah Nakiganda-Busiku , Htet Nay Lin Oo, Suzanne Namusoke Kiwanuka, Asha George,and David H. Peters, “Participatory monitoring and evaluation approaches that influence decision-making: lessons from a maternal and newborn study in Eastern Uganda.” Health Research Policy and Systems, (2017)
Kaner, Sam. Facilitator’s Guide to Participatory Decision-making. Jossey-bass business and management series , 2014
Palaniswamy,Nethra, Smriti Sakhamuri, and Cassandra Xia. “Participatory Tracking: Customizing Visualisations.” Social Observatory, (September 2017)
Participate. “Participatory Research Methods.” Accessed June 6, 2021, https://participatesdgs.org/methods/
Slideshare. “Participatory Rural Appraisal.” Accessed June 6, 2021, https://www.slideshare.net/tmthatchupeacefeul/pra-64022245
World Bank Group Flagship Report, “Data for better lives” (2021), https://openknowledge.worldbank.org/handle/10986/35218
Featured Blog Posts

Get The Latest From The Social Sector In Your Inbox!

Subscribe to our newsletter